Analyze a Real Public Dataset
Maps to: Data Analyst · Quantitative Analyst · Marketing Analyst · Journalist · Researcher · Consultant
You're going to take a real question you care about, find a public dataset that can answer it, and publish a piece that argues a finding with real charts. The skill is analytical judgment: deciding what the data actually supports versus what you hoped to find, and not over-claiming when it's close. That's the real work of a data analyst, the call about what's true and what isn't, and doing one tells you fast whether digging for an honest answer is your kind of work.
How this shows up on a resume or college app
I analyzed [dataset] to answer [question], publishing a piece with charts that argued [finding], and being honest about what the data did and didn't support. I learned that the hard part of data analysis is asking the right question and not over-claiming the answer, not running the code.
When you finish, BuildMe drafts your Common App activity description from what you actually built.
The plan
- 1
Step 1
Pick a question + find a real dataset
Pick a question you actually care about, then find a real, accessible dataset that can answer it. Confirm the data exists and you can get it before you fall in love with the question. The question is the whole project.
- 2
Step 2
AI writes the analysis + you verify
Use AI to write and run the Python/SQL that cleans and analyzes the data, then verify the findings make sense. Real datasets are messy (missing values, weird formats); the cleaning slog is most of data work, not a detour.
- 3
Steps 3–4
Build charts + decide what the data actually supports
Build 2–3 clear charts. Then the judgment: look at the results and decide what the data actually supports vs. what you hoped to find, and what you got wrong. The discipline is not over-claiming; a smaller honest finding beats a big shaky one.
- 4
Steps 5–6
Write + publish
Write the 1,000–1,500 word piece that argues your finding with the charts, and publish it. Share it and get reads. A clear argument from real data is a genuine analyst portfolio piece.
Sign up and this plan gets personalized to your level, interests, and goal in about 15 seconds.
Tools you'll use
Real examples for inspiration

Classic Rock is Changing — 20 years of Q104.3 countdown data
Chris Dalla Riva
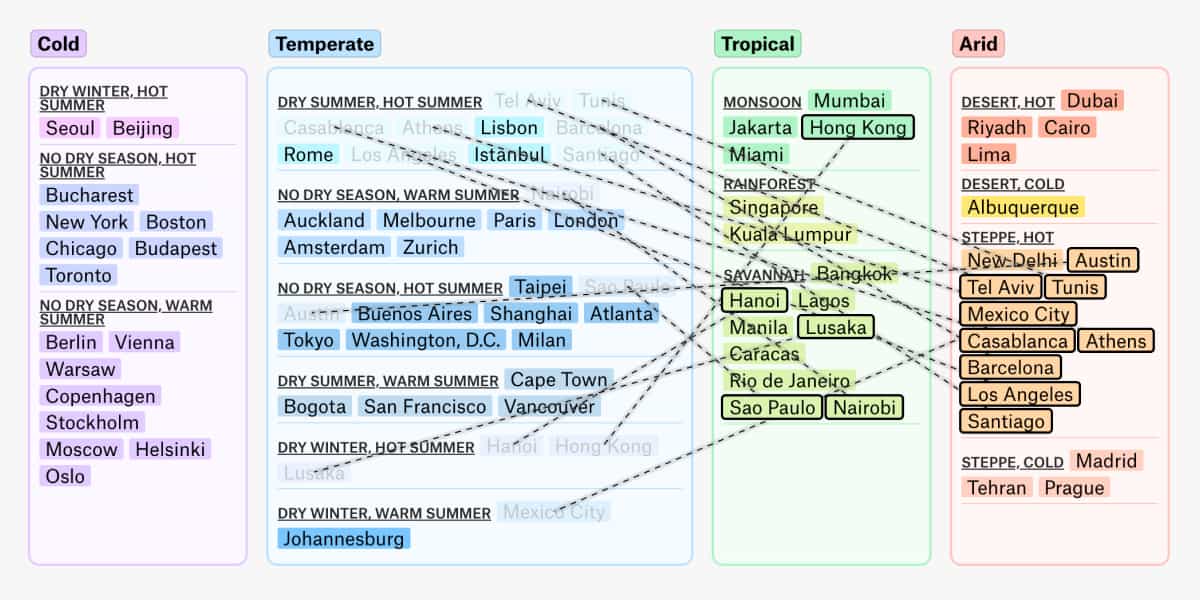
Climate Zones — how 70 cities will feel in 2070
Derek Taylor
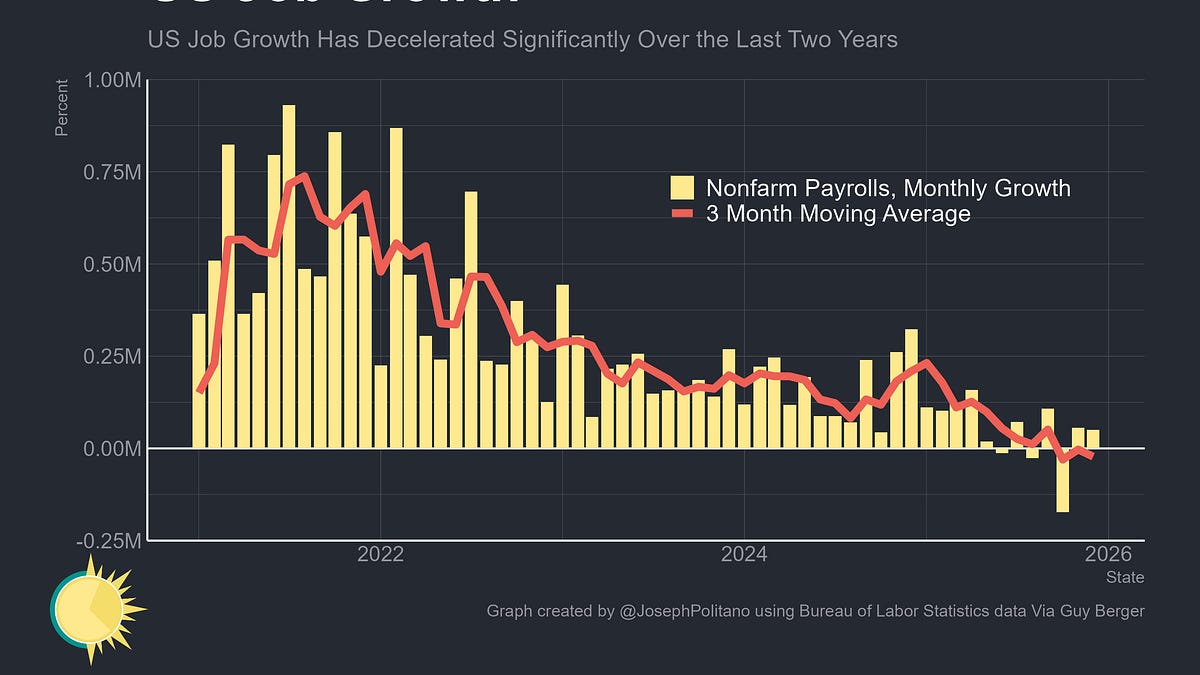
The 'No Hire' Economy — what a year of labor data says about who can't get hired
Joseph Politano

Games Are Too Long — counting why NBA games gained 90 seconds
Owen Phillips
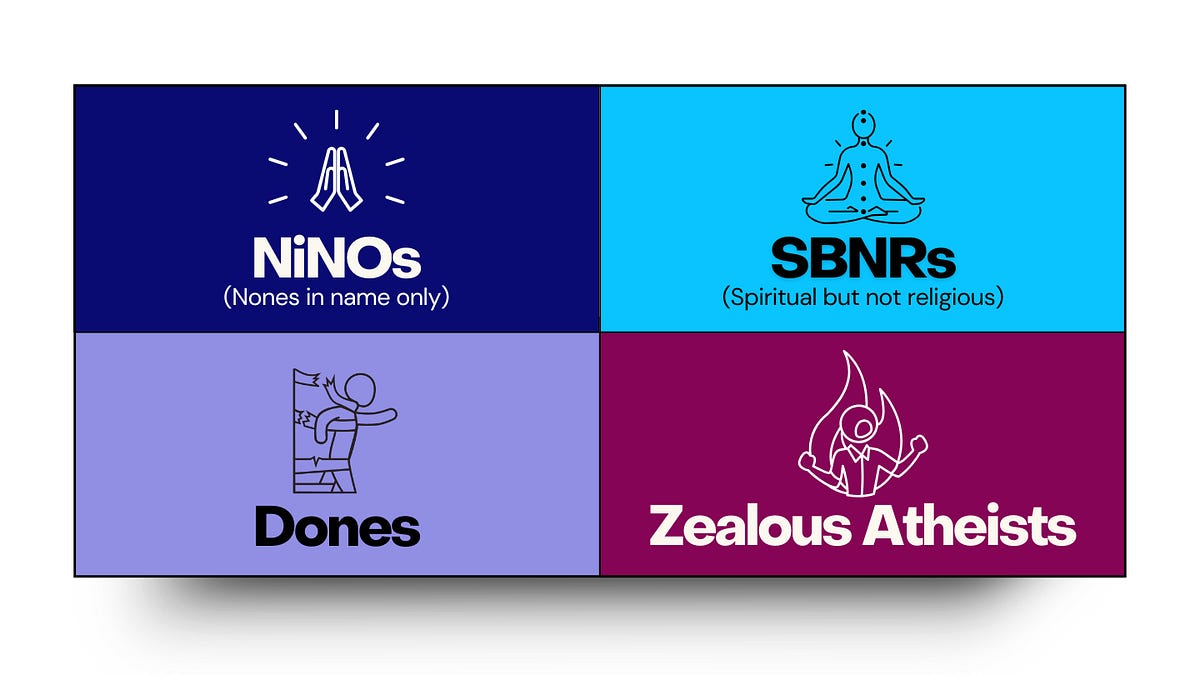
The Four Types of Nones — k-means clustering 12,014 non-religious Americans
Ryan Burge